
WordPress PageSpeed optimization can become one of the most difficult parts of building a website. Installing a cache plugin is easy; making Performance, Accessibility, Best Practices and SEO all turn green—without breaking menus, forms, animations or mobile layouts—is where the real work begins.
ChatGPT can make this process faster. It can explain technical reports, organize problems by priority and suggest commands for your hosting terminal. But it is not a magic “make everything green” button. You still need enough technical knowledge to recognize risky advice, make a backup, test one change at a time and restore the site if something goes wrong.
This guide shows a safer approach: use PageSpeed Insights to find front-end problems, use read-only cPanel Terminal commands to collect server and WordPress information, then ask ChatGPT to help interpret the results. None of the 10 diagnostic commands below deletes files, changes the database or modifies WordPress settings.
What does “all green” actually mean?
PageSpeed Insights combines two different types of data. Lighthouse runs a controlled laboratory test, while Core Web Vitals can include field data from real Chrome users. A Lighthouse category turns green at a score of 90–100. Google also says a perfect 100 is extremely challenging and is not expected for every site.
For real-user Core Web Vitals, “good” currently means Largest Contentful Paint (LCP) at 2.5 seconds or less, Interaction to Next Paint (INP) at 200 milliseconds or less, and Cumulative Layout Shift (CLS) at 0.1 or less, measured at the 75th percentile. That distinction matters: a single green lab test does not automatically mean every real visitor has a green experience.
- LCP: how quickly the main visible content appears.
- INP: how quickly the page responds to an interaction.
- CLS: how stable the layout remains while loading.
- TTFB: how long the server takes to begin responding; it strongly affects the loading chain.
The goal should be a fast, stable website for real people—not a fragile 100 that disappears after the next plugin update.
How ChatGPT helps with WordPress PageSpeed optimization
ChatGPT is most useful as an assistant between the report and the fix. You can give it the PageSpeed opportunities, the affected URL and safe diagnostic output from your server. It can then:
- Translate technical warnings into plain English.
- Separate hosting, database, image, CSS, JavaScript and third-party-script problems.
- Connect an issue to LCP, INP, CLS or TTFB.
- Identify which checks are most likely to produce a meaningful improvement.
- Suggest a one-change-at-a-time test plan.
- Help compare results before and after a change.
- Prepare rollback steps before a risky optimization.
It cannot see everything from a copied score. It may not know how your theme, page builder, checkout, cookie banner or custom code behaves. It can also misunderstand command output. Treat its answer as a technical recommendation that must be reviewed—not as permission to execute every command.
How to find Terminal in cPanel
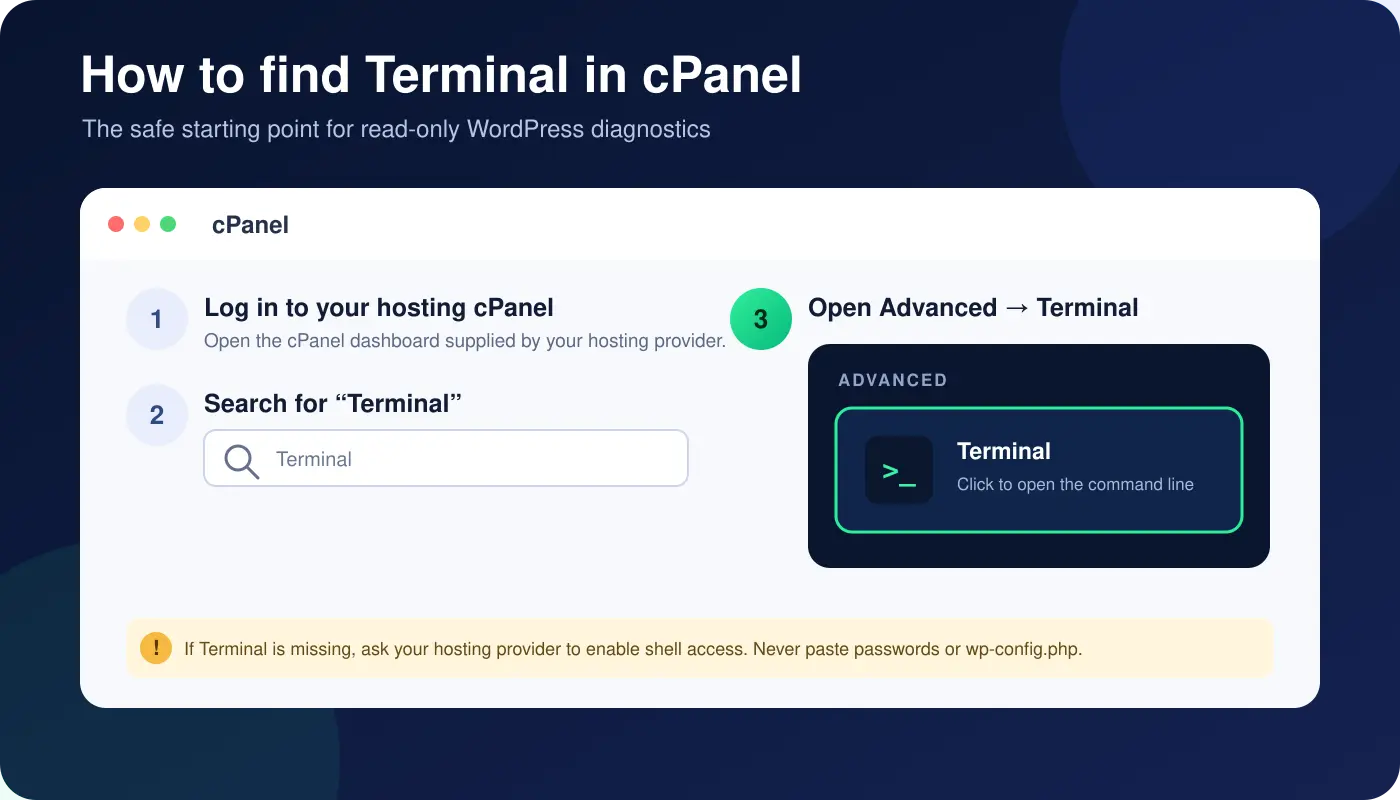
Log in to cPanel, use the search field to find Terminal, then open it under Advanced. The official cPanel documentation describes the path as cPanel → Home → Advanced → Terminal. If it is missing, your hosting provider may have disabled shell access.
cPanel itself warns that Terminal commands can make an account inoperable. Start by locating the WordPress installation. On many shared-hosting accounts it is in public_html:
cd "$HOME/public_html" || exit 1If your WordPress site is installed in a subfolder or addon-domain directory, use the correct path instead. The commands below also assume that WP-CLI is available. If the terminal says wp: command not found, ask the host whether WP-CLI is installed.
10 safe cPanel Terminal commands to diagnose PageSpeed
Run one command at a time. Read the output before continuing. These commands diagnose common causes; they do not promise to identify every browser-rendering or third-party-script problem.
1. Check WP-CLI, PHP and WordPress versions
wp --info
php -v
wp core version
This establishes the server environment. Outdated PHP or WordPress can affect security, compatibility and sometimes performance, but never upgrade blindly on a live site.
2. List active plugins and available updates
wp plugin list --status=active --fields=name,status,version,update --format=tableA long plugin list does not automatically mean a slow site. The more useful question is which plugins load large assets, run expensive queries or duplicate another plugin’s work.
3. Identify the active theme and version
wp theme list --status=active --fields=name,status,version,update --format=tableThe active theme and page builder affect how CSS, JavaScript, fonts, menus and animations load. This information helps ChatGPT avoid giving generic advice that conflicts with your setup.
4. Find the largest database tables
wp db size --tables --human-readable --orderby=size --order=descOversized logging, session, analytics or post-meta tables can slow uncached requests and dashboard operations. Size alone is not proof that a table should be cleaned. First identify which plugin owns it and create a database backup.
5. Check the largest autoloaded options
wp option list --autoload=on --fields=option_name,size_bytes --format=table | sort -k2 -nr | head -n 25Autoloaded options are loaded on many WordPress requests. A few very large entries can contribute to slow processing and TTFB. Do not delete an unfamiliar option just because it is large.
6. Find oversized images in the uploads folder
find wp-content/uploads -type f ( -iname '*.jpg' -o -iname '*.jpeg' -o -iname '*.png' -o -iname '*.webp' ) -size +500k -exec du -h {} + | sort -hr | head -n 30Large hero and background images are common LCP problems. Before replacing them, check their displayed dimensions, responsive srcset, compression and whether the above-the-fold image was incorrectly lazy-loaded.
7. Find the largest CSS and JavaScript files
find wp-content -type f ( -iname '*.css' -o -iname '*.js' ) -exec du -h {} + | sort -hr | head -n 30This reveals large local assets, but it does not show which files are actually loaded on a page or how much code is unused. Confirm the result with the Lighthouse report or Chrome DevTools before excluding, delaying or removing anything.
8. Review scheduled WordPress cron events
wp cron event list --fields=hook,next_run_relative,recurrence --format=table | head -n 40Frequent background jobs from backups, feeds, optimization, security or ecommerce plugins can compete for limited shared-hosting resources. Do not disable a cron event until you know its purpose.
9. Measure the homepage server response
SITE_URL="$(wp option get home)"
curl -L -s -o /dev/null -w 'HTTP=%{http_code}nTTFB=%{time_starttransfer}snTotal=%{time_total}snSize=%{size_download} bytesn' "$SITE_URL"
This provides a quick server-side sample. Run it more than once because the first request may be uncached. It is not a replacement for real-user monitoring or mobile PageSpeed testing.
10. Check cache and compression response headers
SITE_URL="$(wp option get home)"
curl -sSIL "$SITE_URL" | grep -Ei '^(HTTP/|cache-control:|content-encoding:|content-type:|server:|x-litespeed-cache:|cf-cache-status:)'
These headers can indicate redirects, page-cache status, compression and CDN behavior. Header names vary by host, so a missing LiteSpeed or Cloudflare header does not automatically mean caching is broken.
The best diagnostic report to share with ChatGPT
If you prefer one report, the following command group collects a compact, read-only snapshot and saves it in your account home directory. Review the file before sharing it.
cd "$HOME/public_html" || exit 1
REPORT_FILE="$HOME/pagespeed-diagnostic-report.txt"
SITE_URL="$(wp option get home)"
{
  echo '=== ENVIRONMENT ==='
  wp --info
  php -v
  wp core version
  echo '=== ACTIVE PLUGINS ==='
  wp plugin list --status=active --fields=name,status,version,update --format=table
  echo '=== ACTIVE THEME ==='
  wp theme list --status=active --fields=name,status,version,update --format=table
  echo '=== LARGEST DATABASE TABLES ==='
  wp db size --tables --human-readable --orderby=size --order=desc | head -n 25
  echo '=== LARGEST AUTOLOAD OPTIONS ==='
  wp option list --autoload=on --fields=option_name,size_bytes --format=table | sort -k2 -nr | head -n 25
  echo '=== LARGE IMAGES ==='
  find wp-content/uploads -type f ( -iname '*.jpg' -o -iname '*.jpeg' -o -iname '*.png' -o -iname '*.webp' ) -size +500k -exec du -h {} + | sort -hr | head -n 30
  echo '=== RESPONSE TIME ==='
  curl -L -s -o /dev/null -w 'HTTP=%{http_code}nTTFB=%{time_starttransfer}snTotal=%{time_total}snSize=%{size_download} bytesn' "$SITE_URL"
  echo '=== CACHE HEADERS ==='
  curl -sSIL "$SITE_URL" | grep -Ei '^(HTTP/|cache-control:|content-encoding:|content-type:|server:|x-litespeed-cache:|cf-cache-status:)'
} > "$REPORT_FILE"
echo "Report saved to: $REPORT_FILE"
Open the report with less "$HOME/pagespeed-diagnostic-report.txt" and press q to exit. Never paste wp-config.php, an .env file, database credentials, API keys, passwords, security tokens, private customer data or an unreviewed full error log into ChatGPT.
A better prompt to get a safer answer
I am diagnosing a WordPress website on shared LiteSpeed hosting. I will paste a PageSpeed report and read-only terminal output below.
Explain the findings in plain English and rank them by likely impact on LCP, INP, CLS and TTFB. Separate confirmed facts from possibilities. Recommend only one safe change at a time, include a backup and rollback step, and explain how to verify the result.
Do not suggest deleting database options, editing theme/plugin PHP files, changing URLs, disabling security, or running destructive commands. Ask me for missing information instead of guessing. Pay special attention to menus, animations, forms, ecommerce, cookie controls and mobile layout.
Then paste only the relevant PageSpeed opportunities and the reviewed diagnostic output. Include the exact page tested, whether the result is mobile or desktop, the active theme or builder, the cache plugin and what has already been tried.
What Terminal commands cannot diagnose
Terminal is excellent for server and WordPress diagnostics, but it cannot fully reproduce how a browser paints and responds to a page. You still need PageSpeed Insights or Chrome DevTools to identify:
- The exact LCP element and its request chain.
- Layout shifts caused by fonts, banners, sliders or late-loading content.
- Long JavaScript tasks that hurt INP.
- Third-party scripts from analytics, chat, maps, ads or video embeds.
- Render-blocking CSS and unused front-end code.
- Differences between mobile, desktop, logged-in and logged-out visitors.
That is why the strongest workflow combines browser data with safe server checks. Google’s own optimization guidance prioritizes making the LCP resource discoverable and high priority, reducing TTFB, reserving space to prevent CLS and avoiding unnecessary JavaScript work.
The safe workflow: diagnose, change, test, repeat
- Test the important page on both mobile and desktop.
- Save the PageSpeed report and record the current metrics.
- Back up the database and files before any meaningful change.
- Run only the read-only checks related to the suspected problem.
- Ask ChatGPT to explain the evidence and propose one reversible change.
- Review the recommendation for your theme, builder and plugins.
- Apply one change in staging when possible.
- Check menus, animations, forms, cookie controls, checkout and mobile layout.
- Purge only the necessary caches.
- Retest several times and keep the change only if the site remains stable.
Some settings can raise one Lighthouse score while creating a worse real experience. Delaying JavaScript can break menus or consent tools. Aggressive CSS optimization can cause flashes, missing styles or unstable tests. Lazy-loading the main hero image can make LCP worse. “More optimization” is not always better optimization.
Need help making PageSpeed green safely?
If you understand the basics, ChatGPT and cPanel Terminal can save hours of investigation. If the output is confusing—or if the website is already serving customers—the safer choice is to have the work reviewed and tested professionally.
I provide careful WordPress PageSpeed optimization and website management services. I work one safe change at a time, keep backups, test the important website functions and avoid risky “one-click” settings that can damage the user experience. The aim is not just a green screenshot; it is a fast, stable website that remains usable.
Have a PageSpeed report you do not understand? Send the report through the contact form and include the affected URL, your hosting type, WordPress theme or builder and cache plugin.
Trusted resources
- Chrome Developers: Lighthouse performance scoring
- web.dev: Core Web Vitals thresholds
- web.dev: Effective ways to improve Core Web Vitals
- cPanel documentation: Terminal for cPanel
- WordPress Developer Resources: WP-CLI commands
- WordPress: wp db size
- WordPress: wp option list
Need help improving your website?
I can help with UX/UI, website development, SEO and performance improvements. Tell me what your website needs.